OMNIVIS project 2009
Hamiltonian Flow Computation
OMNIVIS: Omni-directional Vision
Office: SciCtr 434
Email: knill@math.harvard.edu
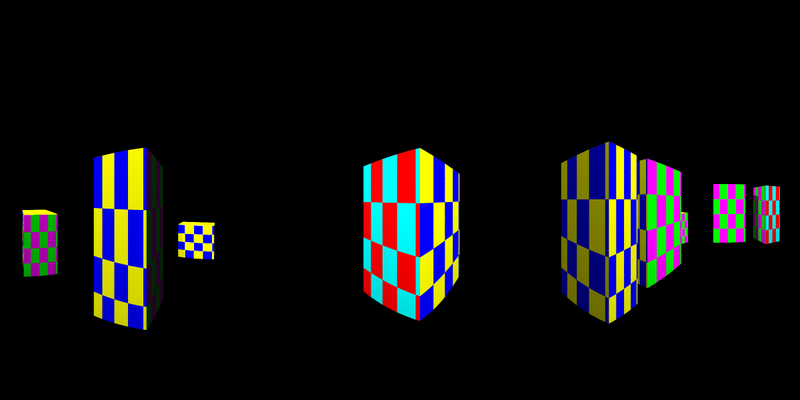
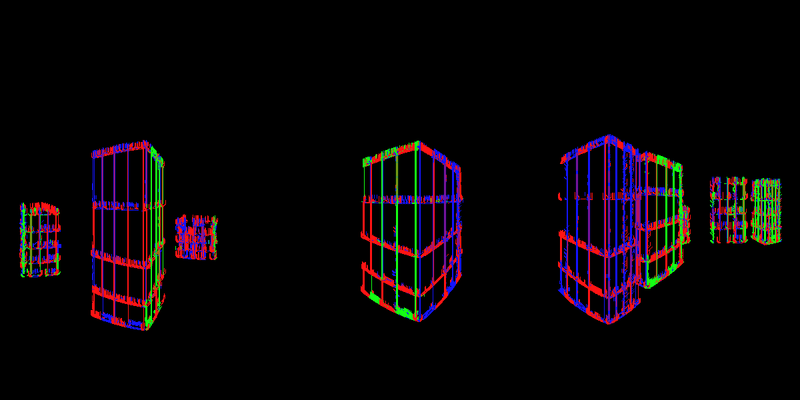
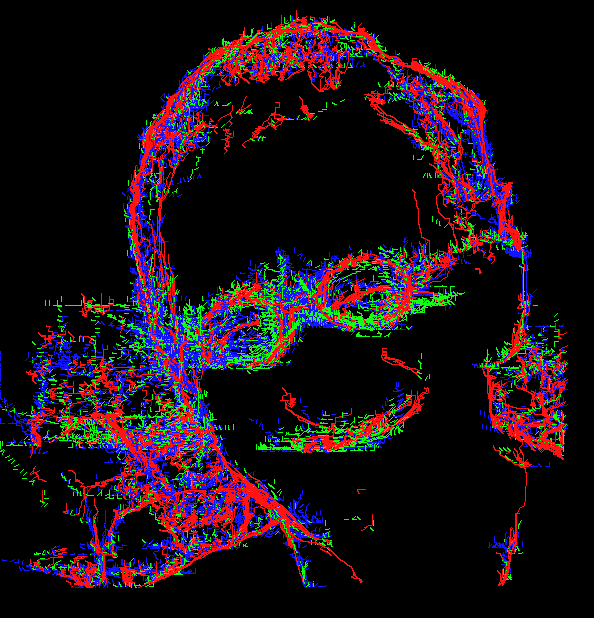
For each color, the color density function f produces a Hamiltonian
vector field J nabla f, which when followed sketches out parts of the
picture because the flow lines of this vector fields are close to the
level curves.
We did this here for two examples. We start to compute flow
lines only at places, where the curvature is large enough.  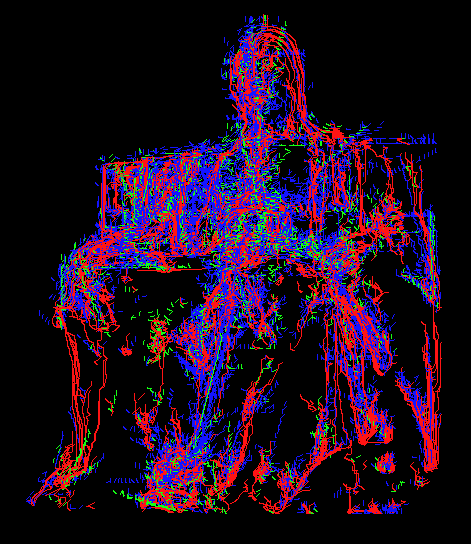
|