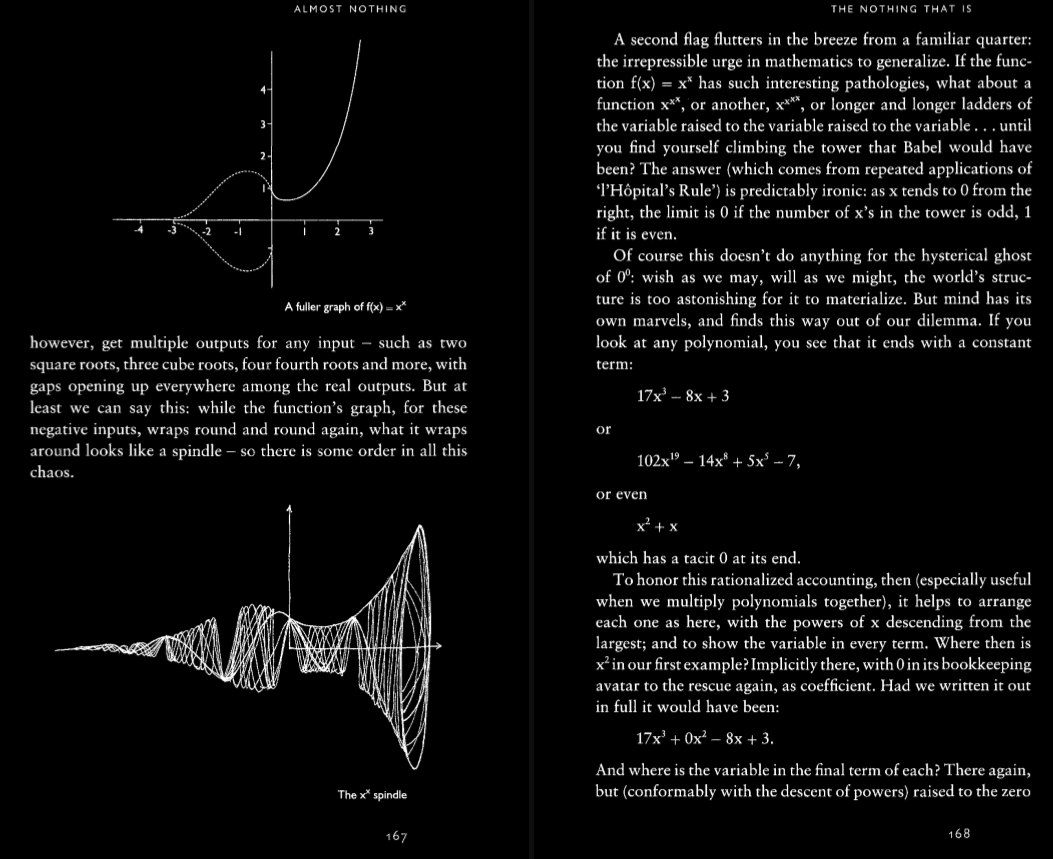
The function f(x) = x
x is pretty cool! One can write
it as f(x) = exp(i log(x)) but since the log has complex values and is
not uniquely determined, the function is actually multi valued.
For any k, we get a function f(x) = exp(i (log(x) + 2 π k) which
has a real and imaginary part. How can we visualize this? The best is
to write it as parametrized curves r(t) = < t, Re(f(t)), Im(f(t)) >.
The resulting curves define what one calls the x
x spindle.
Here is a picture drawn in Mathematica. We take k=1,2,3,4,5.
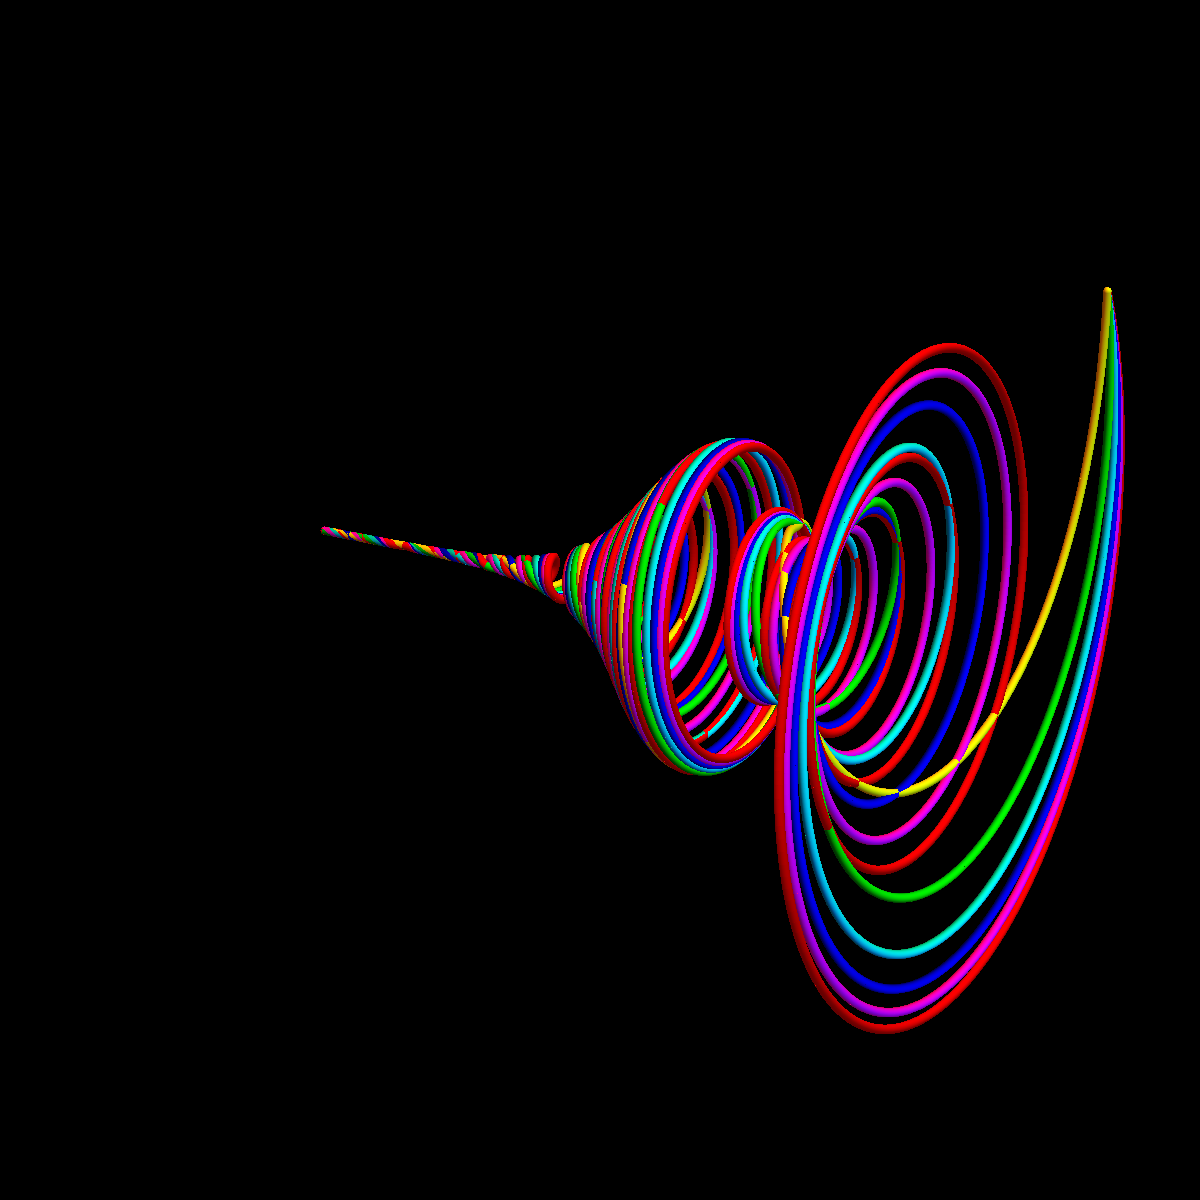
This term can be found in the book of Robert Kaplan
The nothing that is
on page 167.