In a homework, we illustrated the
exponential map on the Clifford torus.
You can look at this with a computer. Paste the following into mathematica and move
the slider to see the wave front move.
Manipulate[ParametricPlot[Mod[r{Cos[t],Sin[t]},1],{t,0,2Pi}],{r,0.1,5}]
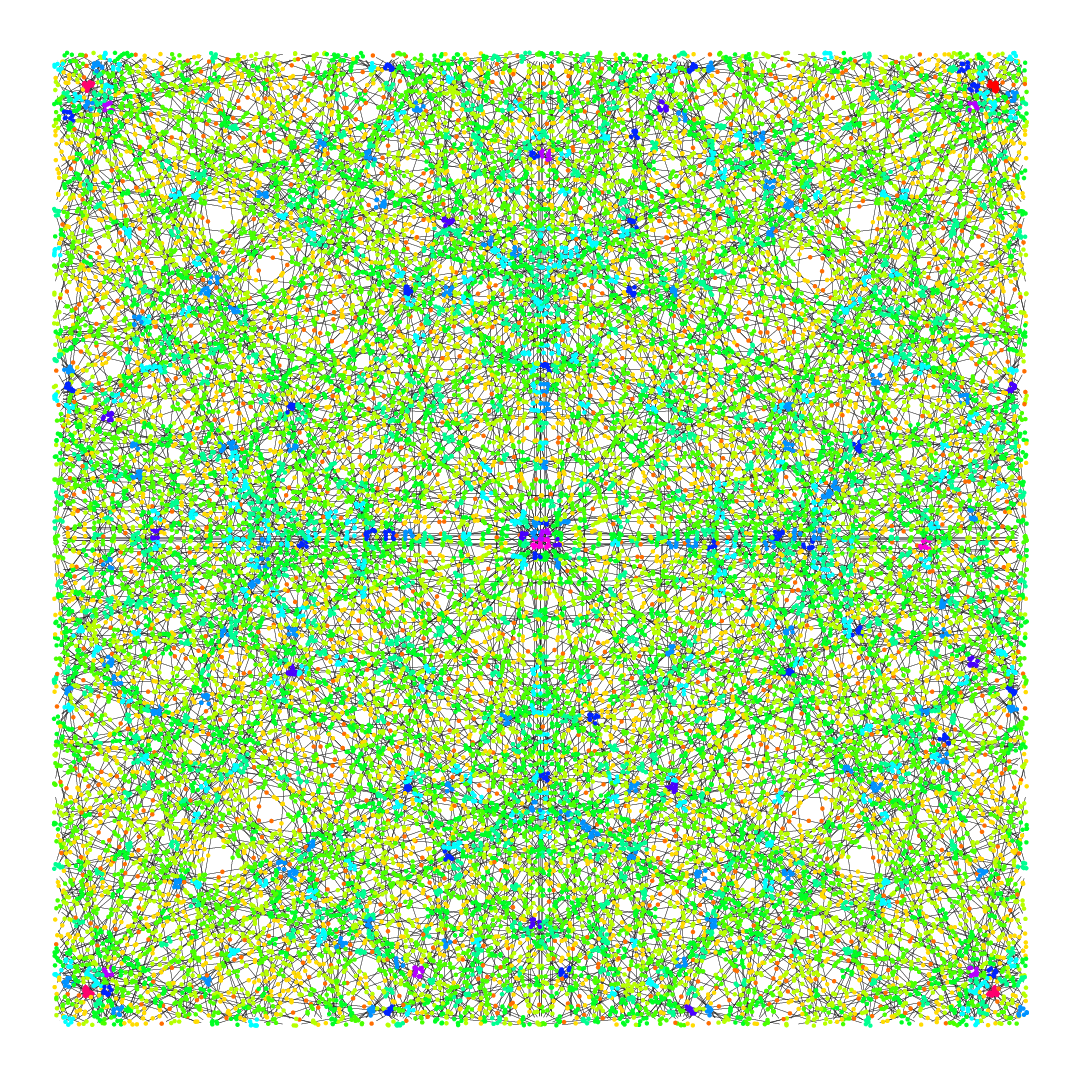
Here is a more sophisticated picture, where the wave front density is
colorized. We proved in
this paper
from 2024 that the wave front becomes dense in a precise way. The details on how
the density behaves is highly nontrivial however.